| A Living, Breathing Caldera |
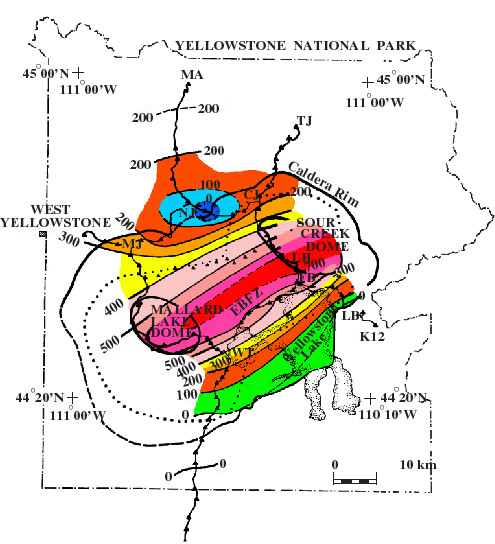
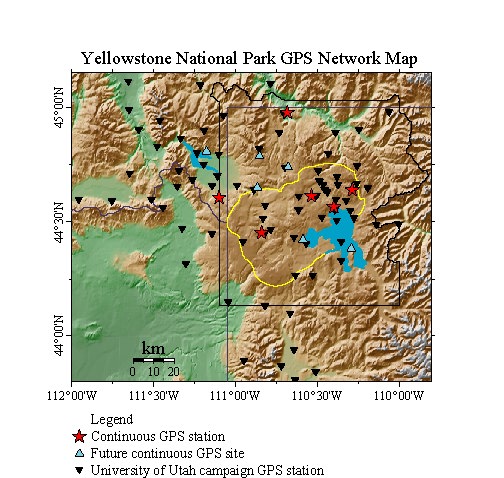
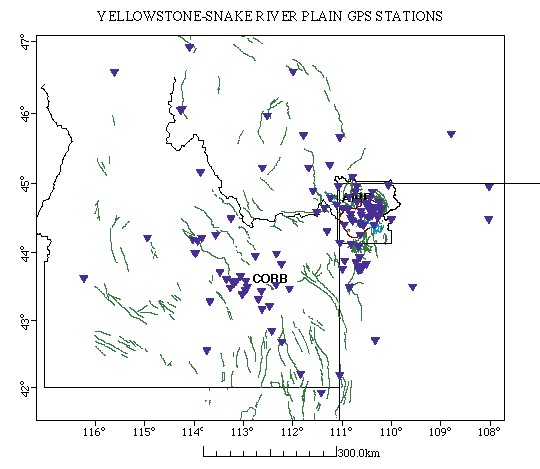
Crustal Deformation of the Yellowstone Hotspot, 1923-1995Crustal deformation of active volcanic features are important indicators of their degree of activity. Yellowstone is an example of a giant caldera that has exhibited unprecedented caldera-wide deformation and has earned a reputation of a caldera at unrest, indeed a living, breathing caldera. Caldera Uplift, 1923-1985While subsidence of the Snake River Plain over its 16 Ma history reflects the long-term deformation pattern of that region, the Yellowstone Plateau has been the site of rapid crustal deformation in historic time. Pelton and Smith (1982) first documented the historical uplift of the Yellowstone caldera of up to 76 cm based upon repeated 1st-order precision leveling in 1975-76-77 at benchmarks originally surveyed in 1923. From the mid-1970's to 1984, leveling surveys revealed an additional 25 cm of uplift. However, by 1985 the deformation had reversed to subsidence, and the subsidence had exceeded ~20 cm by 1995 (Dzurisin and Yamashita, 1987; Meertens and Smith, 1995). Models of the uplift show that its depth extended from the surface to 9 km in depth. For the uplift data, a maximum volume change of 0.218 km³, in the 3 km to 6 km depth range was determined in the southern caldera and a second source of 0.185 km³ volume increase located in the northeast caldera. The total volume change for the 1923 to 1977 data totaled ~0.73 km³ and was attributed to migration of magmas and/or hydrothermal fluids into the upper crust. This corresponds to an inflation rate of 0.01 km³/yr to 0.03 km³/yr from magmatic fluids intruded into the upper crust. Causative mechanisms for the caldera-wide uplift, summarized by Pelton and Smith (1982), included magmatic, tectonic, and glacial-isostatic sources, but these authors suggested that the most likely source of the 1923-1977 uplift was by transport of magma. Dzurisin and others (1990) concluded that basaltic intrusions into the mid- or upper crust or pressurization of a deep hydrothermal system by magmatic gas, or brine, released by crystallization of a rhyolitic melt were also plausible sources for the uplift. Caldera Subsidence, 1985-1995GPS Measurments of Caldera DeformationFollowing the 50-year episode of historical uplift, deformation abruptly changed to subsidence of up to 6 cm between 1984 and 1985 (Dzurisin and others, 1990), and subsidence has continued to 1991. Meertens and others (1992) reported subsidence of up to 7 cm for the period 1987 to 1991 over the entire caldera using GPS (Global Positioning Satellites) corresponding to the same general area which experienced uplift from 1923 to 1977. The spatial correlation between the area of uplift and the area of subsidence suggests a causative mechanism related to magmatic/hydrothermal intrusion followed by fluid migration or degassing from the same source. The 1923-1977 uplift phase of the Yellowstone caldera is postulated to have resulted by melts and/or hydrothermal fluid intrusion at depths of 3 to 6 km upper crust. These fluids may have in turn produced excess hydrothermal fluid/gases in a shallow overlying layer which then degassed and/or experienced a reduced rate of hydrothermal fluid input, producing the observed subsidence from 1985-1991. Evidence of a widespread magmatic connection between the Yellowstone caldera and the Hebgen Lake fault was recently suggested by Savage and others (1993) who modeled the strain field of the Hebgen Lake trilateration network for the period 1973-1987. The calculated uniaxial extension was 0.27 µstrains at an azimuth of 015°. Although these data can be explained by dislocation on a southward-dipping normal fault at Hebgen Lake, the data imply significant deformation north of the surface projection of the Hebgen Lake fault. Savage and others (1993) suggested an alternate mechanism related to magmatism, namely inflation of a vertical dike and accompanying rift that extends west-northwest ~100 km from the Yellowstone caldera to the Hebgen Lake fault zone. This is a provocative interpretation of the crustal deformation, but it provides a tie between tectonic and magmatic mechanisms across a large area of the Yellowstone Plateau. Nonetheless, we believe that the of migration of melts and/or hydrothermal fluids into the mid- and upper-crust of the Yellowstone caldera is the most plausible explanation for the modern crustal deformation. This mechanism must have been important over much of the 2 Ma volcanic history of Yellowstone, and magmatism must have been the principal mechanism in the development of the resurgent domes. The modeled volume changes of Yellowstone's historic crustal deformation are consistent with intrusion of hydrothermal fluids and rhyolitic/basaltic melts into the upper crust as a likely mechanism. In 1987 the University of Utah began biannual GPS (Global Positioning System) surveys of the entire Yellowstone-Hebgen Lake-Teton region that established more than 80 GPS sites. This project was funded by the NSF and its purpose was to measure contemporary deformation of the Yellowstone hotspot. This crustal deformation information was then used as input to studies of the kinematic framework and intraplate tectonic setting of the Yellowstone hotspot. The GPS data also provide a baseline for further surveillance of crustal motion that could result from magma intrusion or impending earthquakes. The new GPS methodology allows the determination of the location of points on the Earth's surface to an accuracy of a few centimeters (for an introduction to GPS methodology, click here). With this new technology, scientists can observe the coordinates of the points periodically and determine how fast the ground is moving vertically and horizontally.
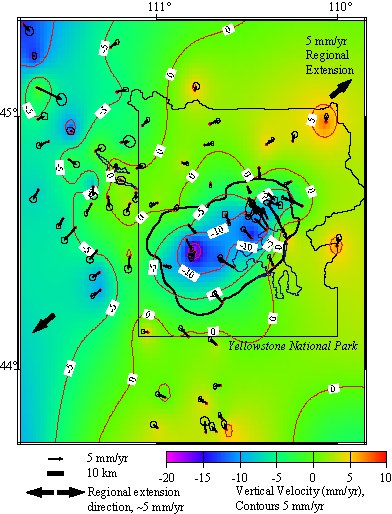
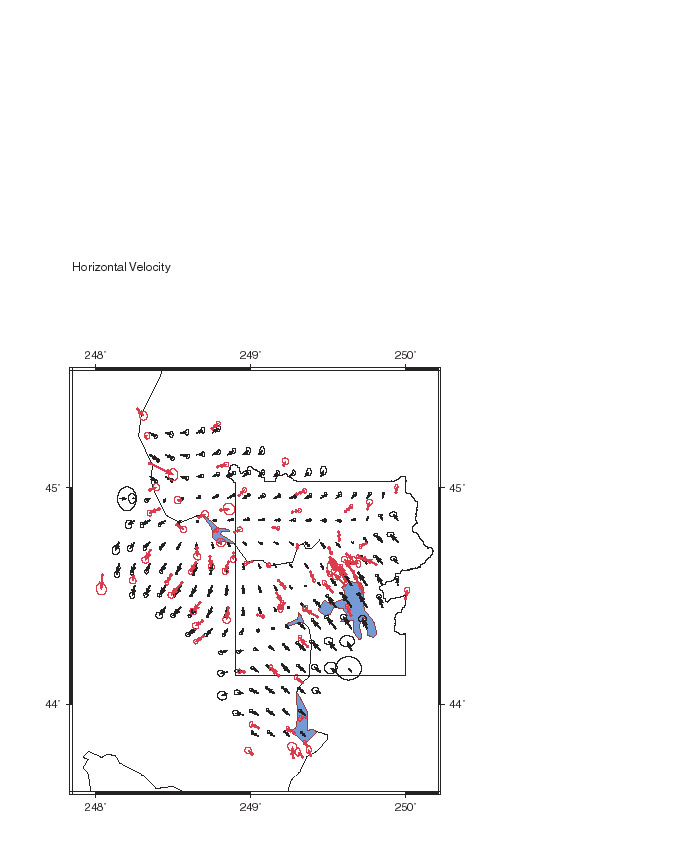
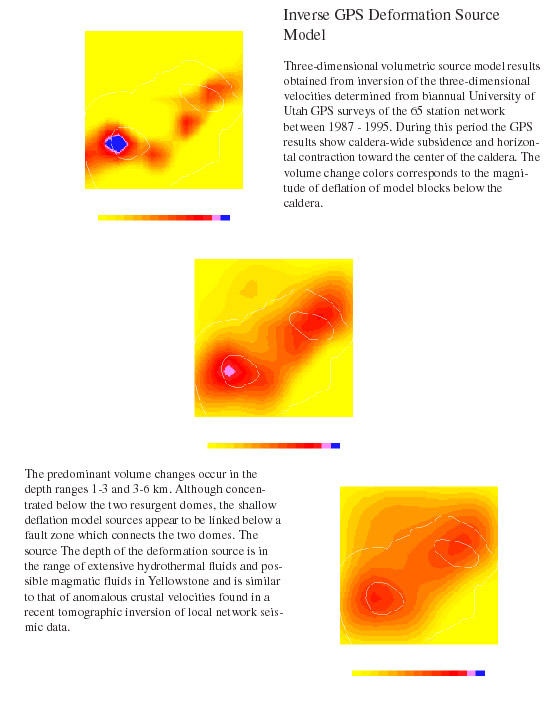
The University of Utah study was followed by additional leveling surveys by the USGS (project leader Dan Dzurisin) that revealed continued uplift to ~1984, but then a sudden reversal to caldera subsidence. Profiles of caldera deformation by the USGS, Cascades Volcano Observatory can be seen here. The new Yellowstone GPS studies, however, provided greatly expanded areal coverage of the Yellowstone region in areas not accessible with standard geodetic surveys and included 85 stations. Portions of this network were surveyed biannually with an emphasis on the Yellowstone Plateau. A summary of the horizontal GPS velocity field for the Yellowstone Plateau, determined from 1987 to 1995, is shown here. Red vectors represent measurements at GPS stations, black vectors represent the calculated velocity field An additional 65 GPS sites were added in 1995 to expand the coverage around a much larger area, up to 200 km from Yellowstone, affected by the hotspot including the Snake River Plain and areas in Montana, Idaho, Wyoming and Utah. Velocities were determined from a combination of GPS campaign results from 1987 to 1995 for the Yellowstone Plateau, focussing on the Yellowstone caldera. Vertical deformation contours are also shown in the figure. Most apparent is the subsidence of up to 1.5 cm/yr in the center of the Yellowstone caldera, with horizontal motion vectors oriented toward the center at up to 1.1 cm/yr. Furthermore, the process continued between 1993 and 1995 at approximately the same rate. Note that the smaller error ellipses, one sigma, reflect more frequent and/or longer intervals between repeated surveys. Vertical errors, not shown in the figure, are typically 25 to 50% larger. The region of subsidence extends well beyond the caldera boundary, especially to the northeast. The combination of subsidence and contraction clearly points to a large-scale volumetric decrease at depth as a source. In contrast, a strain-coupling mechanism such as the Hebgen Lake fault acting on the highly modified caldera crust, would show subsidence and northerly extension. Therefore strain-coupling cannot be the dominant source for the observed deformation. Forward and inverse modeling of the 1987-1993 GPS displacements indicates sill-like bodies of upper crustal deflation, 3 to 6 km below the surface. A map of these volumetric sources suggests they are likely the result of fluid changes within each modeled element. Notably, the volumetric sources are located in the same depth range as postulated by geochemists for hydrothermal and possible magmatic fluid reservoirs in Yellowstone. They also are remarkably similar in location to areas of anomalously low seismic velocities determined in a recent P- and S-wave tomographic inversion of local earthquake and explosion source seismic data described above. Deformation of Surrounding Fault ZonesDeformation Of The Hebgen Lake Fault ZoneOur initial GPS network covered two active fault zones. On the west side of the Yellowstone Plateau, the Hebgen Lake fault experienced the largest historic earthquake in the Basin-Range, the Ms = 7.5, 1959 Hebgen Lake earthquake. Repeated GPS surveys of all or portions of the Hebgen Lake network between 1987-1993 revealed ongoing horizontal velocities at high rates of 3 to 5 mm/yr. extension in a N-NE direction. Remarkably, horizontal deformation has continued for several decades following the 1959 Hebgen Lake earthquake. We note that there are insufficient aftershocks to match the equivalent seismic moment for this anomalously high rate. In contrast, no significant vertical motion is apparent in the GPS measurements. Deformation Of The Teton Fault ZoneThe Teton fault zone, 10 km to the south of Yellowstone, is characterized by very high Holocene slip rates of ~1-2 mm/yr . However, the relative GPS horizontal and vertical velocities in the Teton fault network are less than 1 mm/yr. This rate is much smaller than that calculated from neotectonic and trenching studies by the University of Utah, suggesting that dominant NE extension observed at Hebgen Lake appears to die out before the Teton Range. Collaborative Research with with Arthur SylvesterWe discuss here our collaborative research on crustal deformation of the Teton fault with Professor Art Sylvester of the Univ. of California, Santa Barbara. In 1987 the University established 44 benchmarks on a 21 km east-west line that crosses the Teton fault in the middle of the Teton Range. The points have been observed periodically since then and expanded in 1995 to extend across the entire Jackson Hole valley. Our initial observations of the level line revealed that the hanging wall (valley of Jackson Hole) rose while the footwall (Teton Range) rose. This pattern is opposite to what a normal fault is expected to do prior to a large earthquake, and several explanations, including east-west compression, migration of seismicity from the fault, near surface ground water expansion of the valley floor, etc. have been put forth. The most recent observation of the Teton level line shows that the valley floor still remains in uplift, and we have not explained these paradoxial observations. | |